Find Green-Acres
in the Play Store !

This table shows the regions with the strongest search variations between 2019 June and 2019 July. Only the localities having more than 3000 visits in the month have been taken into account.
| Top ten risers | % Variation of Visits | Position in the ranking | Change of position in the ranking | Top 10 fallers | % Variation of Visits | Position in the ranking | Change of position in the ranking |
|---|
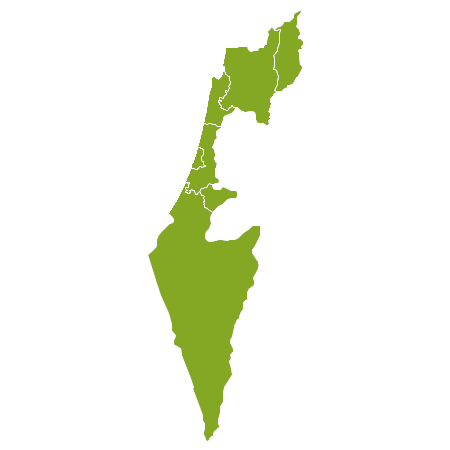
| Kraj | % of searches by Kraj | Position in the ranking | Change of position in the monthly ranking | Change of position in the quarterly ranking | Change of position in the annual ranking | Average price |
|---|---|---|---|---|---|---|
| Tel Aviv District | 79,19 % | 1 | 0 | 0 | 0 | 1 607 871 € |
| Center District | 14,21 % | 2 | 1 | 0 | 4 | 820 966 € |
| Haifa District | 3,55 % | 3 | 1 | 2 | 1 | 490 399 € |
| Jerusalem District | 2,03 % | 4 | -2 | 2 | -1 | 1 511 114 € |
| Southern District | 1,02 % | 5 | 1 | -2 | 0 | 318 223 € |
Detailed reports are available for the following countries: Francie - Španělsko - Portugalsko - Itálie - Řecko